Why do we create visualizations?
- art / media
- story telling
- data analysis
- alternative / comprehensive data representation
- insights
- emerging patterns
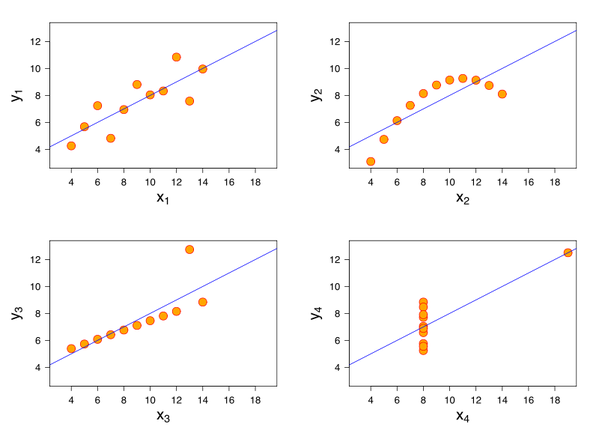
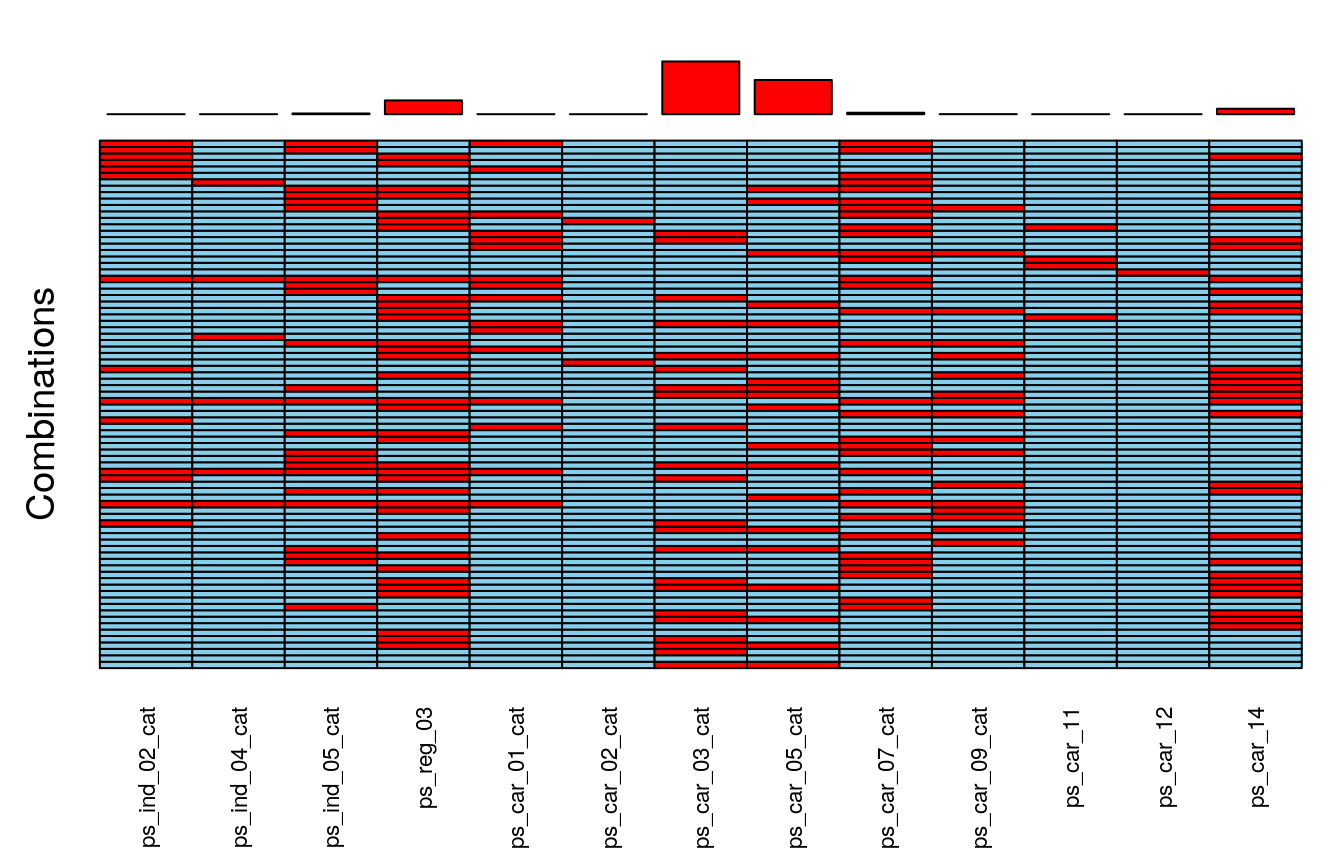
- exploratory data analysis
Alternative data representation
EDA
Insights
Generic relations we are trying to tie together
- numerical
- categorical
- temporal
- spatial
Sample tools
- BI tools
- Static charts / Python / R packages
- Javascript & interactive plots
Things to consider
Things to consider
- supported types of visualization
- supported platforms
- aesthetics / theming
- licensing / pricing
- adapters for your framework
- does data stay on the client or is transfered somewhere?
The way you use solution
The way you use solution
- prebuilt
- JSON / configs
- DSL
Types of visualization
- Charts
- Maps
- Workflow / logical circuits
- Trees
- Miscelanious
Type of charts
Popular solutions
(doesn't mean will fit your project)
- %any chart solution%
- plain html / svg / canvas
- D3
- Leaflet for maps
- Three.js for webgl things
- plumber.js for workflows
D3
@mbostock
- protovis
- d3
- observablehq.com
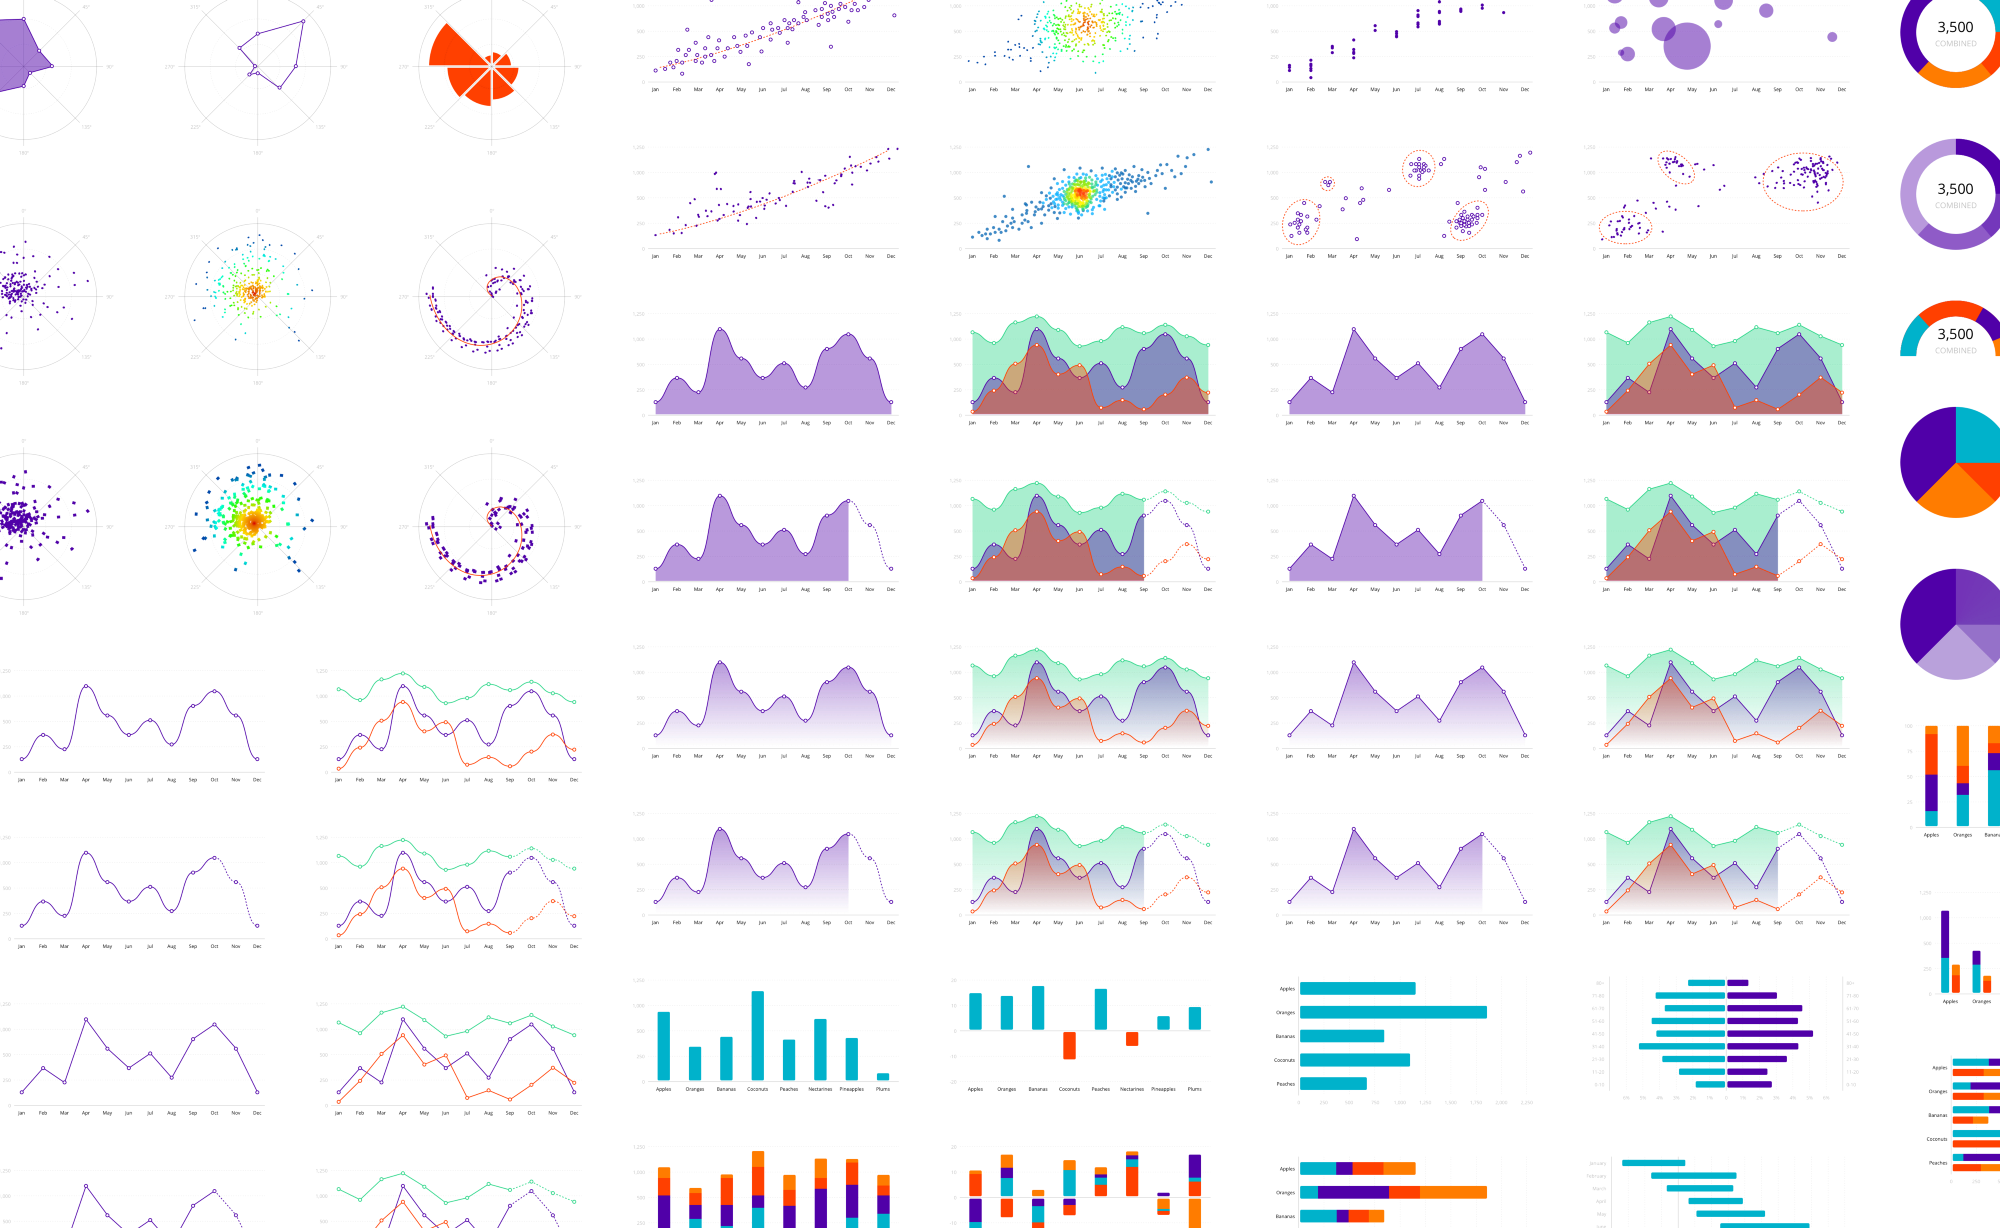
D3 Gallery
Main parts
- data utils
- stats utils
- scales
- axis
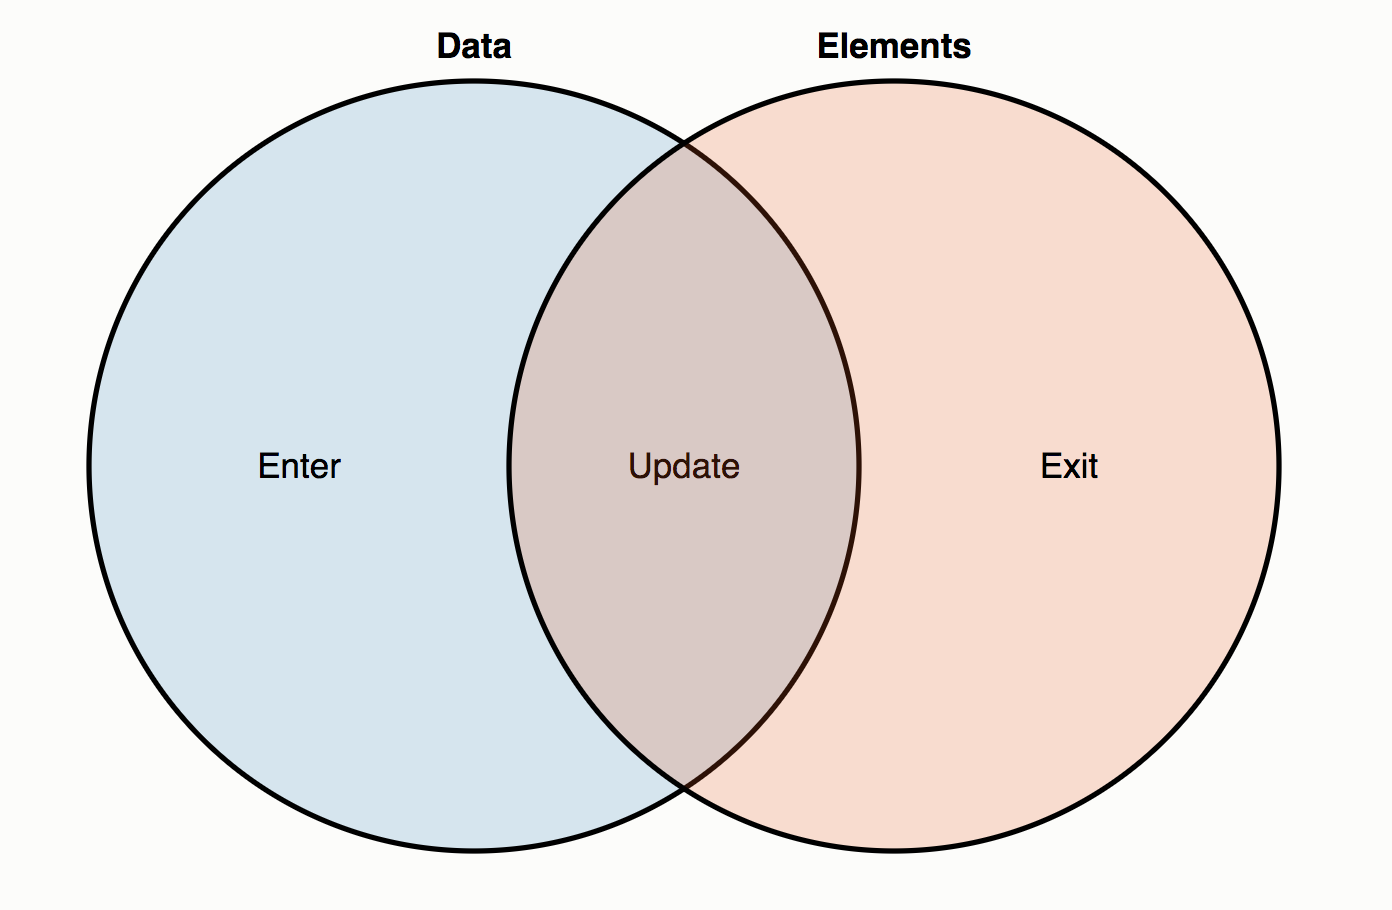
- selections / render
- interactions
- layouts